

The comparison
Against every way we make electricity
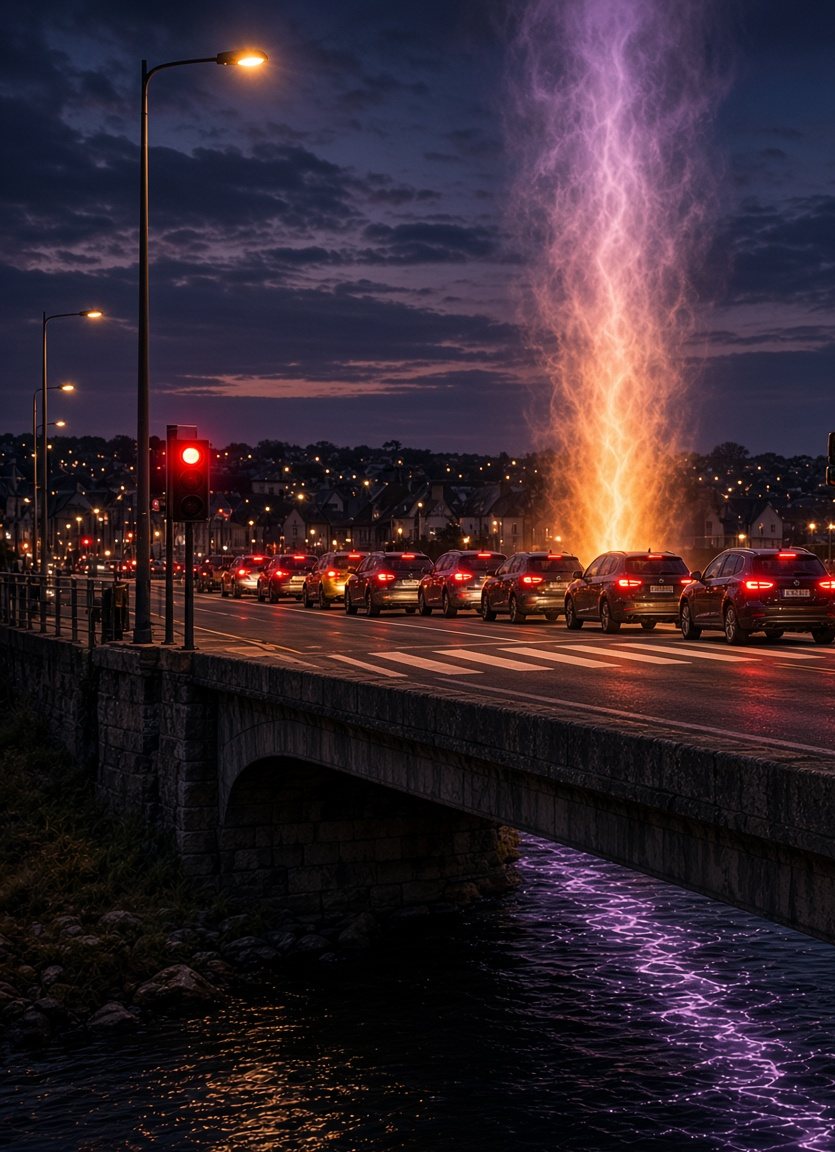
A signalised junction has no meter, no invoice and no line in any national energy account. It is treated as neutral ground. It is not. A busy junction carrying around 18,000 vehicles a day in a 50 km/h zone destroys about 14 GWh of fuel energy a year, a continuous average of about 1,600 kW. Spread across the 350 m² footprint of a node, that is about 4,600 watts for every square metre, day and night, all year.
Per vehicle, that averages about 2.2 kWh of fuel energy each time one passes through. That is more than a single clean stop costs a car, because the average includes heavy goods vehicles, which lose far more at each stop, the repeated stopping and starting in the queue behind the line, and idling while waiting.
| Power density, full land footprint | W/m² |
|---|---|
| One signalised junction, energy destroyed | ~4,600 |
| Gas, combined cycle | ~480 |
| Nuclear, including its planning zone | ~241 |
| Solar, ground mounted | ~6.6 |
| Onshore wind | ~1.8 |
Generation figures are published global medians for operating facilities, from a peer-reviewed meta-analysis of power density (van Zalk and Behrens, Energy Policy, 2018), each on the basis most generous to the generator. The comparison is not like for like, and we say so: generation figures are electricity produced, while the junction figure is fuel energy destroyed. Measured as primary energy instead, a combined-cycle gas plant is closer to about 800 W/m², and the junction still destroys energy several times faster.
Even at only 6,000 vehicles a day in a 50 km/h zone, a junction still destroys energy about seven times faster per square metre than a nuclear station generates it. On the node’s own footprint, there is no realistic signalised junction where this comparison fails.
An unflattering denominator
We use the larger footprint on purpose
The loss is caused by the roughly 30 m² of painted crossing where vehicles are forced to stop. Measured on that, the figure is about ten times higher. We use the node’s full 350 m² instead, because that matches how a power station’s own land is measured, and the conservative figure still wins by an order of magnitude.
Some will argue the right area is the whole queue, the length of road where vehicles brake and wait. But the queue is the symptom, not the cause. It forms on road that already exists to carry traffic, just as a power station is not measured by the roads its fuel arrives on. The loss is forced at the crossing, and that is the part the junction removes. Take it away and the energy is not lost somewhere else. It is never lost at all.
Brake and tyre particulates, exhaust after-treatment and the time lost queuing are all real, and none of them is counted.
Faster roads, bigger losses
It gets worse with speed, not better
The faster the road, the more every stop destroys. The energy in a moving vehicle rises with the square of its speed, but a junction’s total rises less steeply than that, because part of the loss, idling and crawling in the queue, does not depend on the road’s speed. From 50 to 100 km/h, the modelled total rises by about 70%.
| Speed zone | Energy prevented a year | MWh per m² a year | Continuous power |
|---|---|---|---|
| 50 km/h, urban | ~14 GWh | ~40 | ~1.6 MW |
| 60 km/h, national | ~16 GWh | ~45 | ~1.8 MW |
| 80 km/h, interurban | ~18 GWh | ~52 | ~2.1 MW |
| 100 km/h, dual carriageway | ~24 GWh | ~69 | ~2.8 MW |
All at 18,000 vehicles a day, tank to wheel, on a 350 m² footprint. Well to wheel, the 50 km/h figure rises to about 16.8 GWh a year.
The river test
Find your river
Everyone has stood on a bridge and watched a river move. Its current carries real energy, and hydrokinetic turbines can take it out without damming anything, so it is a fair yardstick most people can picture. Well to wheel, one busy crossing destroys about 16.8 GWh a year. After a 1 MW node uses roughly 10 GWh, about 7 GWh a year is still saved.
| River | Mean flow, m³/s | Energy in its whole current, a year | The junction is | The net saving is |
|---|---|---|---|---|
| Columbia, USA | 7,400 | ~32 GWh | 0.5× | 0.2× |
| Rhine, Germany | 2,300 | ~10 GWh | 1.7× | 0.7× |
| Loire, France | 930 | ~4.1 GWh | 4.1× | 1.7× |
| Hudson, USA | 620 | ~2.7 GWh | 6.2× | 2.5× |
| Seine, France | 560 | ~2.5 GWh | 6.7× | 2.7× |
| Potomac, USA | 325 | ~1.4 GWh | 12× | 4.9× |
| Shannon, Ireland | 200 | ~0.9 GWh | 19× | 7.6× |
| Thames, UK | 65 | ~0.3 GWh | 56× | 23× |
Power is ½ρQv² on published mean flows at a single velocity of 1.0 m/s, which is generous to the rivers: halve the velocity and every river figure falls fourfold. Figures are 100% of the current, before any turbine limit.
Only the very largest rivers carry more than one crossing wastes, and only the Columbia and the Rhine carry more than the net saving. The Shannon’s free current is about 0.9 GWh a year, which one crossing beats nineteen times over.
Prevention, not generation
The most productive square metre
Remove the stop, and the same 350 m² prevents about 40 MWh of energy waste per square metre every year, at a density no generator can match, because prevention is not limited by sunshine, wind or a capacity factor. The loss is not recovered or offset. It never occurs.
Value density usually depends on scarcity: Fifth Avenue has forty blocks, and the Hoover Dam has one Colorado River. This is the opposite. Every town already has junctions, so the same result can be repeated everywhere. A region of 100 nodes prevents about 1.4 TWh a year; nine regions, about 12.7 TWh, with no new land.
And the same ground holds the compute
Density, not distance
The most destructive square metre in the built environment can become the most productive. All it takes is changing the shape of the road.